 |
Rocstar
1.0
Rocstar multiphysics simulation application
|


|
|
Rocstar
1.0
Rocstar multiphysics simulation application
|
|
Per-metric QualityAssessor data. More...
#include <QualityAssessor.hpp>
Public Member Functions | |
| Assessor (QualityMetric *metric) | |
| double | get_average () const |
| double | get_maximum () const |
| double | get_minimum () const |
| double | get_rms () const |
| double | get_stddev () const |
| int | get_count () const |
| int | get_invalid_element_count () const |
| void | get_histogram (double &lower_bound_out, double &upper_bound_out, msq_std::vector< int > &counts_out, MsqError &err) const |
| Get historgram of data, if calculated. More... | |
| void | reset_data () |
| Reset all calculated data. More... | |
| void | print_histogram (msq_stdio::ostream &) const |
| Print the histogram. More... | |
| QualityMetric * | get_metric () const |
| Get the QualityMetric. More... | |
| void | add_value (double metric_value) |
| Add a value to the running counts. More... | |
| void | add_hist_value (double metric_value) |
| Add a value to the hisogram data. More... | |
| void | add_invalid_value () |
| Note invalid result. More... | |
| void | calculate_histogram_range () |
| If range of histogram has not yet been determined, calculate it from the min/max values. More... | |
Private Attributes | |
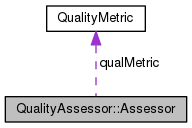
| QualityMetric *const | qualMetric |
| unsigned | funcFlags |
| unsigned long | count |
| double | sum |
| double | maximum |
| double | minimum |
| double | sqrSum |
| unsigned long | numInvalid |
| bool | haveHistRange |
| The histogram counts, where the first and last values are counts of values below the lower bound and above the upper bound, respectively. More... | |
| double | histMin |
| double | histMax |
| msq_std::vector< int > | histogram |
Friends | |
| class | QualityAssessor |
Per-metric QualityAssessor data.
The Assessor class holds QualityAssessor data for each metric added by the calling application, including a pointer to the metric instance, QAFunction flags dictating what is to be calculated and output, histogram parameters, and the variables used to accumulate results as the QualityAssessor is running. It also provides methods to access the calculated data once the QualityAssessor pass is completed.
Definition at line 196 of file includeLinks/QualityAssessor.hpp.
| Assessor | ( | QualityMetric * | metric | ) |
Definition at line 508 of file QualityAssessor/QualityAssessor.cpp.
References QualityAssessor::Assessor::reset_data().
| Assessor | ( | QualityMetric * | metric | ) |
| void add_hist_value | ( | double | metric_value | ) |
Add a value to the hisogram data.
Definition at line 585 of file QualityAssessor/QualityAssessor.cpp.
| void add_hist_value | ( | double | metric_value | ) |
Add a value to the hisogram data.
| void add_invalid_value | ( | ) |
Note invalid result.
Definition at line 580 of file QualityAssessor/QualityAssessor.cpp.
| void add_invalid_value | ( | ) |
Note invalid result.
| void add_value | ( | double | metric_value | ) |
Add a value to the running counts.
| void add_value | ( | double | metric_value | ) |
Add a value to the running counts.
Definition at line 562 of file QualityAssessor/QualityAssessor.cpp.
References QualityAssessor::HISTOGRAM.
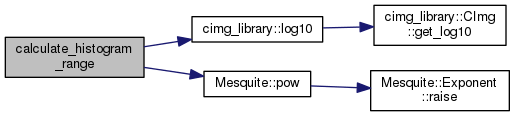
| void calculate_histogram_range | ( | ) |
If range of histogram has not yet been determined, calculate it from the min/max values.
| void calculate_histogram_range | ( | ) |
If range of histogram has not yet been determined, calculate it from the min/max values.
Definition at line 618 of file QualityAssessor/QualityAssessor.cpp.
References cimg_library::log10(), and Mesquite::pow().
| double get_average | ( | ) | const |
| double get_average | ( | ) | const |
Definition at line 141 of file QualityAssessor/QualityAssessor.cpp.
|
inline |
Definition at line 207 of file src/QualityAssessor/QualityAssessor.hpp.
References QualityAssessor::Assessor::count.
|
inline |
Definition at line 207 of file includeLinks/QualityAssessor.hpp.
References QualityAssessor::Assessor::count.
| void get_histogram | ( | double & | lower_bound_out, |
| double & | upper_bound_out, | ||
| msq_std::vector< int > & | counts_out, | ||
| MsqError & | err | ||
| ) | const |
Get historgram of data, if calculated.
| lower_bound_out | The lower bound of the histogram |
| upper_bound_out | The upper bound of the histogram |
| counts_out | An array of counts of elements where the first entry is the number of elements for which the metric is below the lower bound, the last entry is the number of elements above the upper bound, and all other values are the counts for histogram intervals between the lower and upper bounds. |
Definition at line 528 of file QualityAssessor/QualityAssessor.cpp.
References QualityAssessor::HISTOGRAM, MsqError::INVALID_STATE, and MSQ_SETERR.
| void get_histogram | ( | double & | lower_bound_out, |
| double & | upper_bound_out, | ||
| msq_std::vector< int > & | counts_out, | ||
| MsqError & | err | ||
| ) | const |
Get historgram of data, if calculated.
| lower_bound_out | The lower bound of the histogram |
| upper_bound_out | The upper bound of the histogram |
| counts_out | An array of counts of elements where the first entry is the number of elements for which the metric is below the lower bound, the last entry is the number of elements above the upper bound, and all other values are the counts for histogram intervals between the lower and upper bounds. |
|
inline |
Definition at line 209 of file src/QualityAssessor/QualityAssessor.hpp.
References QualityAssessor::Assessor::numInvalid.
|
inline |
Definition at line 209 of file includeLinks/QualityAssessor.hpp.
References QualityAssessor::Assessor::numInvalid.
|
inline |
Definition at line 203 of file includeLinks/QualityAssessor.hpp.
References QualityAssessor::Assessor::maximum.
|
inline |
Definition at line 203 of file src/QualityAssessor/QualityAssessor.hpp.
References QualityAssessor::Assessor::maximum.
|
inline |
Get the QualityMetric.
Definition at line 234 of file includeLinks/QualityAssessor.hpp.
References QualityAssessor::Assessor::qualMetric.
|
inline |
Get the QualityMetric.
Definition at line 234 of file src/QualityAssessor/QualityAssessor.hpp.
References QualityAssessor::Assessor::qualMetric.
|
inline |
Definition at line 204 of file src/QualityAssessor/QualityAssessor.hpp.
References QualityAssessor::Assessor::minimum.
|
inline |
Definition at line 204 of file includeLinks/QualityAssessor.hpp.
References QualityAssessor::Assessor::minimum.
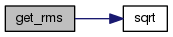
| double get_rms | ( | ) | const |
Definition at line 146 of file QualityAssessor/QualityAssessor.cpp.
References sqrt().
| double get_rms | ( | ) | const |
| double get_stddev | ( | ) | const |
| double get_stddev | ( | ) | const |
Definition at line 151 of file QualityAssessor/QualityAssessor.cpp.
References cimg_library::cimg::sqr(), and sqrt().
| void print_histogram | ( | msq_stdio::ostream & | stream | ) | const |
Print the histogram.
Definition at line 737 of file QualityAssessor/QualityAssessor.cpp.
References i, cimg_library::log10(), max(), and min().
| void print_histogram | ( | msq_stdio::ostream & | ) | const |
Print the histogram.
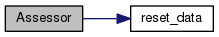
| void reset_data | ( | ) |
Reset all calculated data.
Definition at line 551 of file QualityAssessor/QualityAssessor.cpp.
Referenced by QualityAssessor::Assessor::Assessor().
| void reset_data | ( | ) |
Reset all calculated data.
|
friend |
Definition at line 252 of file includeLinks/QualityAssessor.hpp.
|
private |
Definition at line 257 of file includeLinks/QualityAssessor.hpp.
Referenced by QualityAssessor::Assessor::get_count().
|
private |
Definition at line 255 of file includeLinks/QualityAssessor.hpp.
|
private |
The histogram counts, where the first and last values are counts of values below the lower bound and above the upper bound, respectively.
The remaining values are the histogram counts.
Definition at line 270 of file includeLinks/QualityAssessor.hpp.
|
private |
Definition at line 272 of file includeLinks/QualityAssessor.hpp.
|
private |
Definition at line 271 of file includeLinks/QualityAssessor.hpp.
|
private |
Definition at line 273 of file includeLinks/QualityAssessor.hpp.
|
private |
Definition at line 260 of file includeLinks/QualityAssessor.hpp.
Referenced by QualityAssessor::Assessor::get_maximum().
|
private |
Definition at line 261 of file includeLinks/QualityAssessor.hpp.
Referenced by QualityAssessor::Assessor::get_minimum().
|
private |
Definition at line 263 of file includeLinks/QualityAssessor.hpp.
Referenced by QualityAssessor::Assessor::get_invalid_element_count().
|
private |
Definition at line 254 of file includeLinks/QualityAssessor.hpp.
Referenced by QualityAssessor::Assessor::get_metric().
|
private |
Definition at line 262 of file includeLinks/QualityAssessor.hpp.
|
private |
Definition at line 259 of file includeLinks/QualityAssessor.hpp.
 1.8.5
1.8.5